Using this method as my basis "ROBOT SENSOR INTERPRETATION" from the Society of Robots web site and with reference to "Linearizing Sharp Ranger Data" , an excellent article on the Acroname web site, I began my conversion. Using OpenOffice Calc requires slightly different steps than the Society of Robots article.
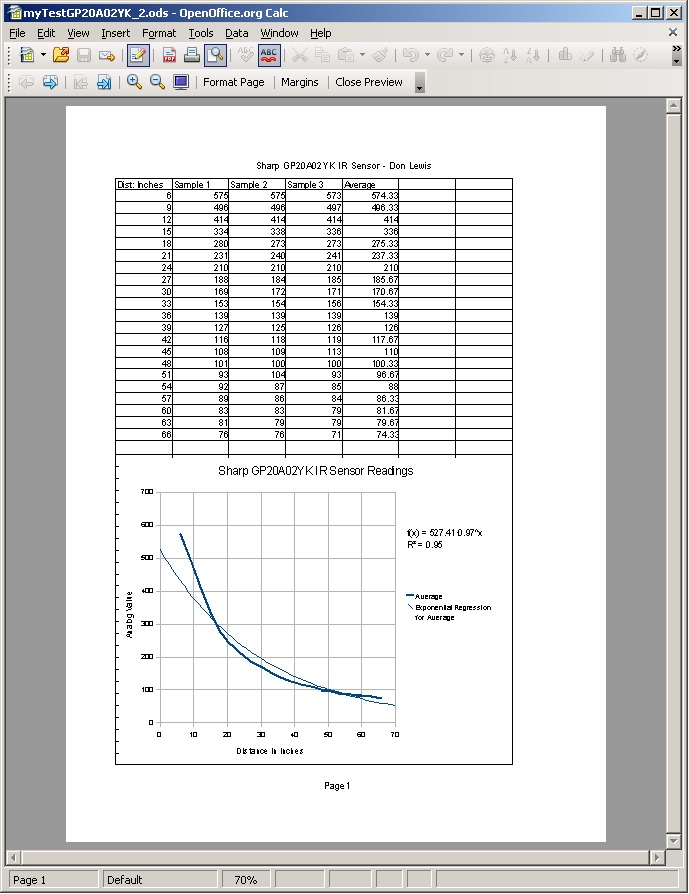
Referring to the image below, I took three sensor readings per each 3 inches from 6 to 66 inches (see column 1) and averaged the readings to column 5. I took the first column representing distance and the last column of averages for my graph.
Graph Sensor Data:
Ok now that you have all your data recorded in two columns in Excel or OpenOffice Calc it is time to graph it. 1) First scroll with your mouse and highlight the cells with data in the first column.
2) Then hold Ctrl and scroll the cells in the other column of data. You should now have two columns seperately highlighted.
3) Next click the graph button in the top menu.
4) A window should open up. Select XY (Scatter). Then in Chart sub-type select 'Points and Lines' the second graphic box. Experiment with these to decide what is best for you. Click next.
5) Select Data Series in Columns, First Row as Label. Click next.
Generate Line Equation:
After determining what kind of graph you have, now all you need to do is use the excel or calc trendline ability. This will convert any line into a simple equation. 1) If there is no non-continuities (kinks in the graph), right click the line in the graph, and click 'Insert Trendline..."
2) Now select the Trend/Regression type. In this case select Exponential and check both 'Show equation' and 'Show correletion coefficient (R^2). Click OK.
note: moving the cursor over the chart's formula will make a x-y arrows icon, pressing left mouse button you can drag the formula over to right side.
3) Given any x data value, the equation should produce distance from the analog data.
Here my results differ with the authors "ROBOT SENSOR INTERPRETATION" results. Using the OpenOffice Calc provided formula resulted in extreme values for x. A few minutes study and testing and a couple of minor changes to the formula provided the expected x values. The original ( f(x) = 527.41 * 0.97^x ) was modified to
[ (f(x) = 527.41 * 9.5 * 1/x) ]where (x) is any analog reading from the average column and 9.5 is taken from the correlation coefficient(R^2 = 0.95), (*) represents multiplication, (^) represents to a power or exponentiation.
The original PDF copy of this Calc spreadsheet image.